While I watched my son draw diagonals in shapes as part of his basic Right Start curriculum, I immediately thought of graph theory. If kids can draw lines between vertices in a shape, they can start to think about the relationships between the lines and the vertices. Graphs are frequently used for modeling problems in computer science, and make for fun puzzle-like activities.
So, I googled “Graph Theory for Kids” and VOILA! I found Dr. Joel David Hamkin’s website. He put together an amazing booklet of activities for his daughter’s class, that explains graphs in a simple, step-by-step, and engaging way.
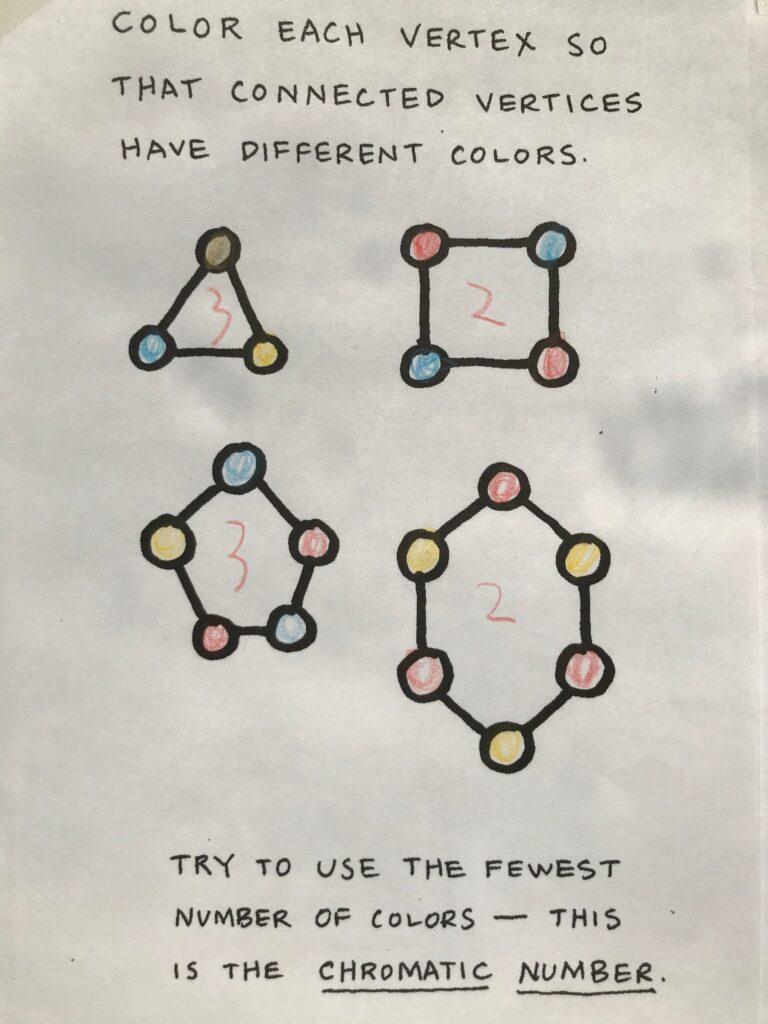
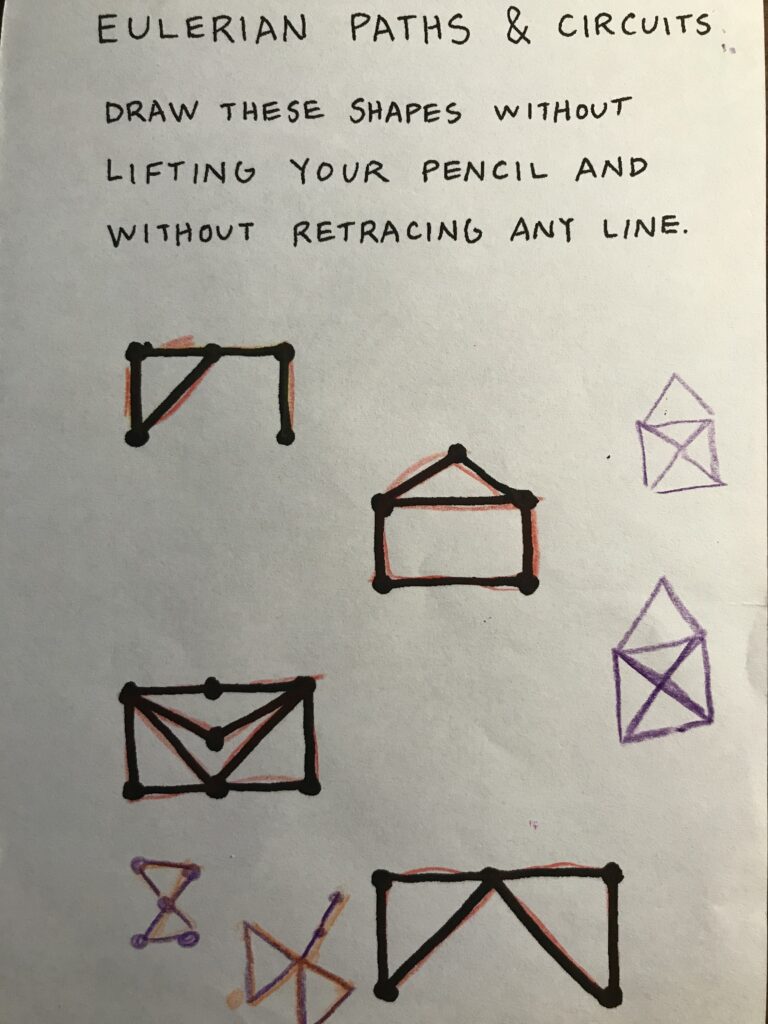
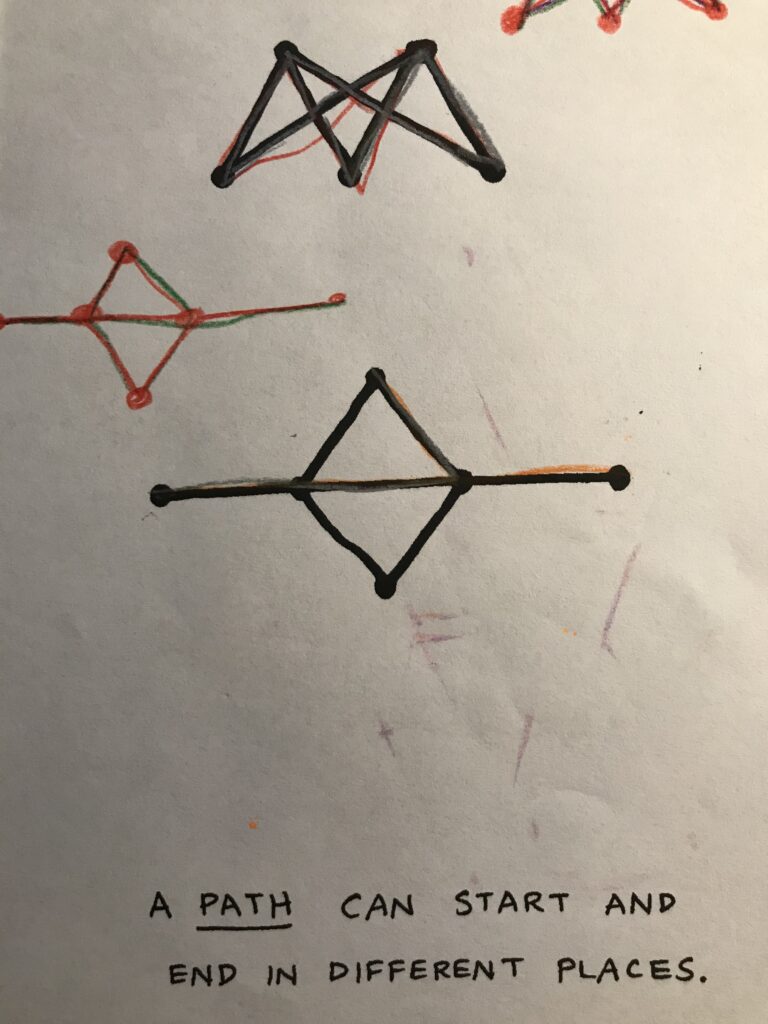
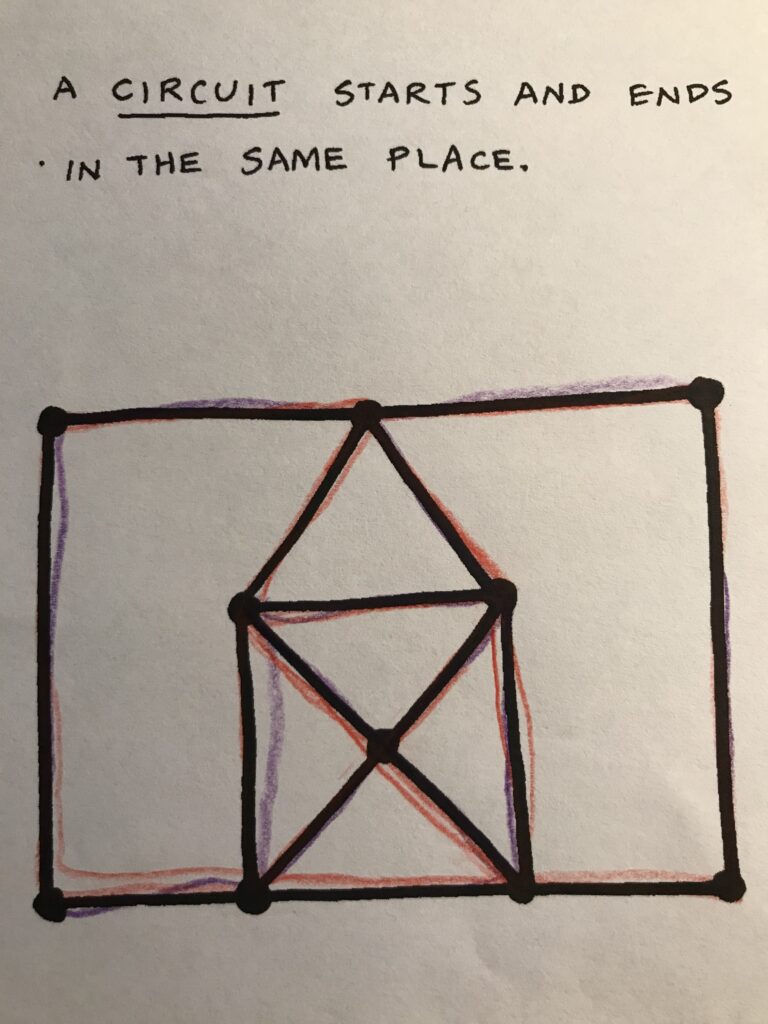
We followed through his booklet, learning about Chromatic Numbers, Mapping, and Eulerian Circuits and Paths.
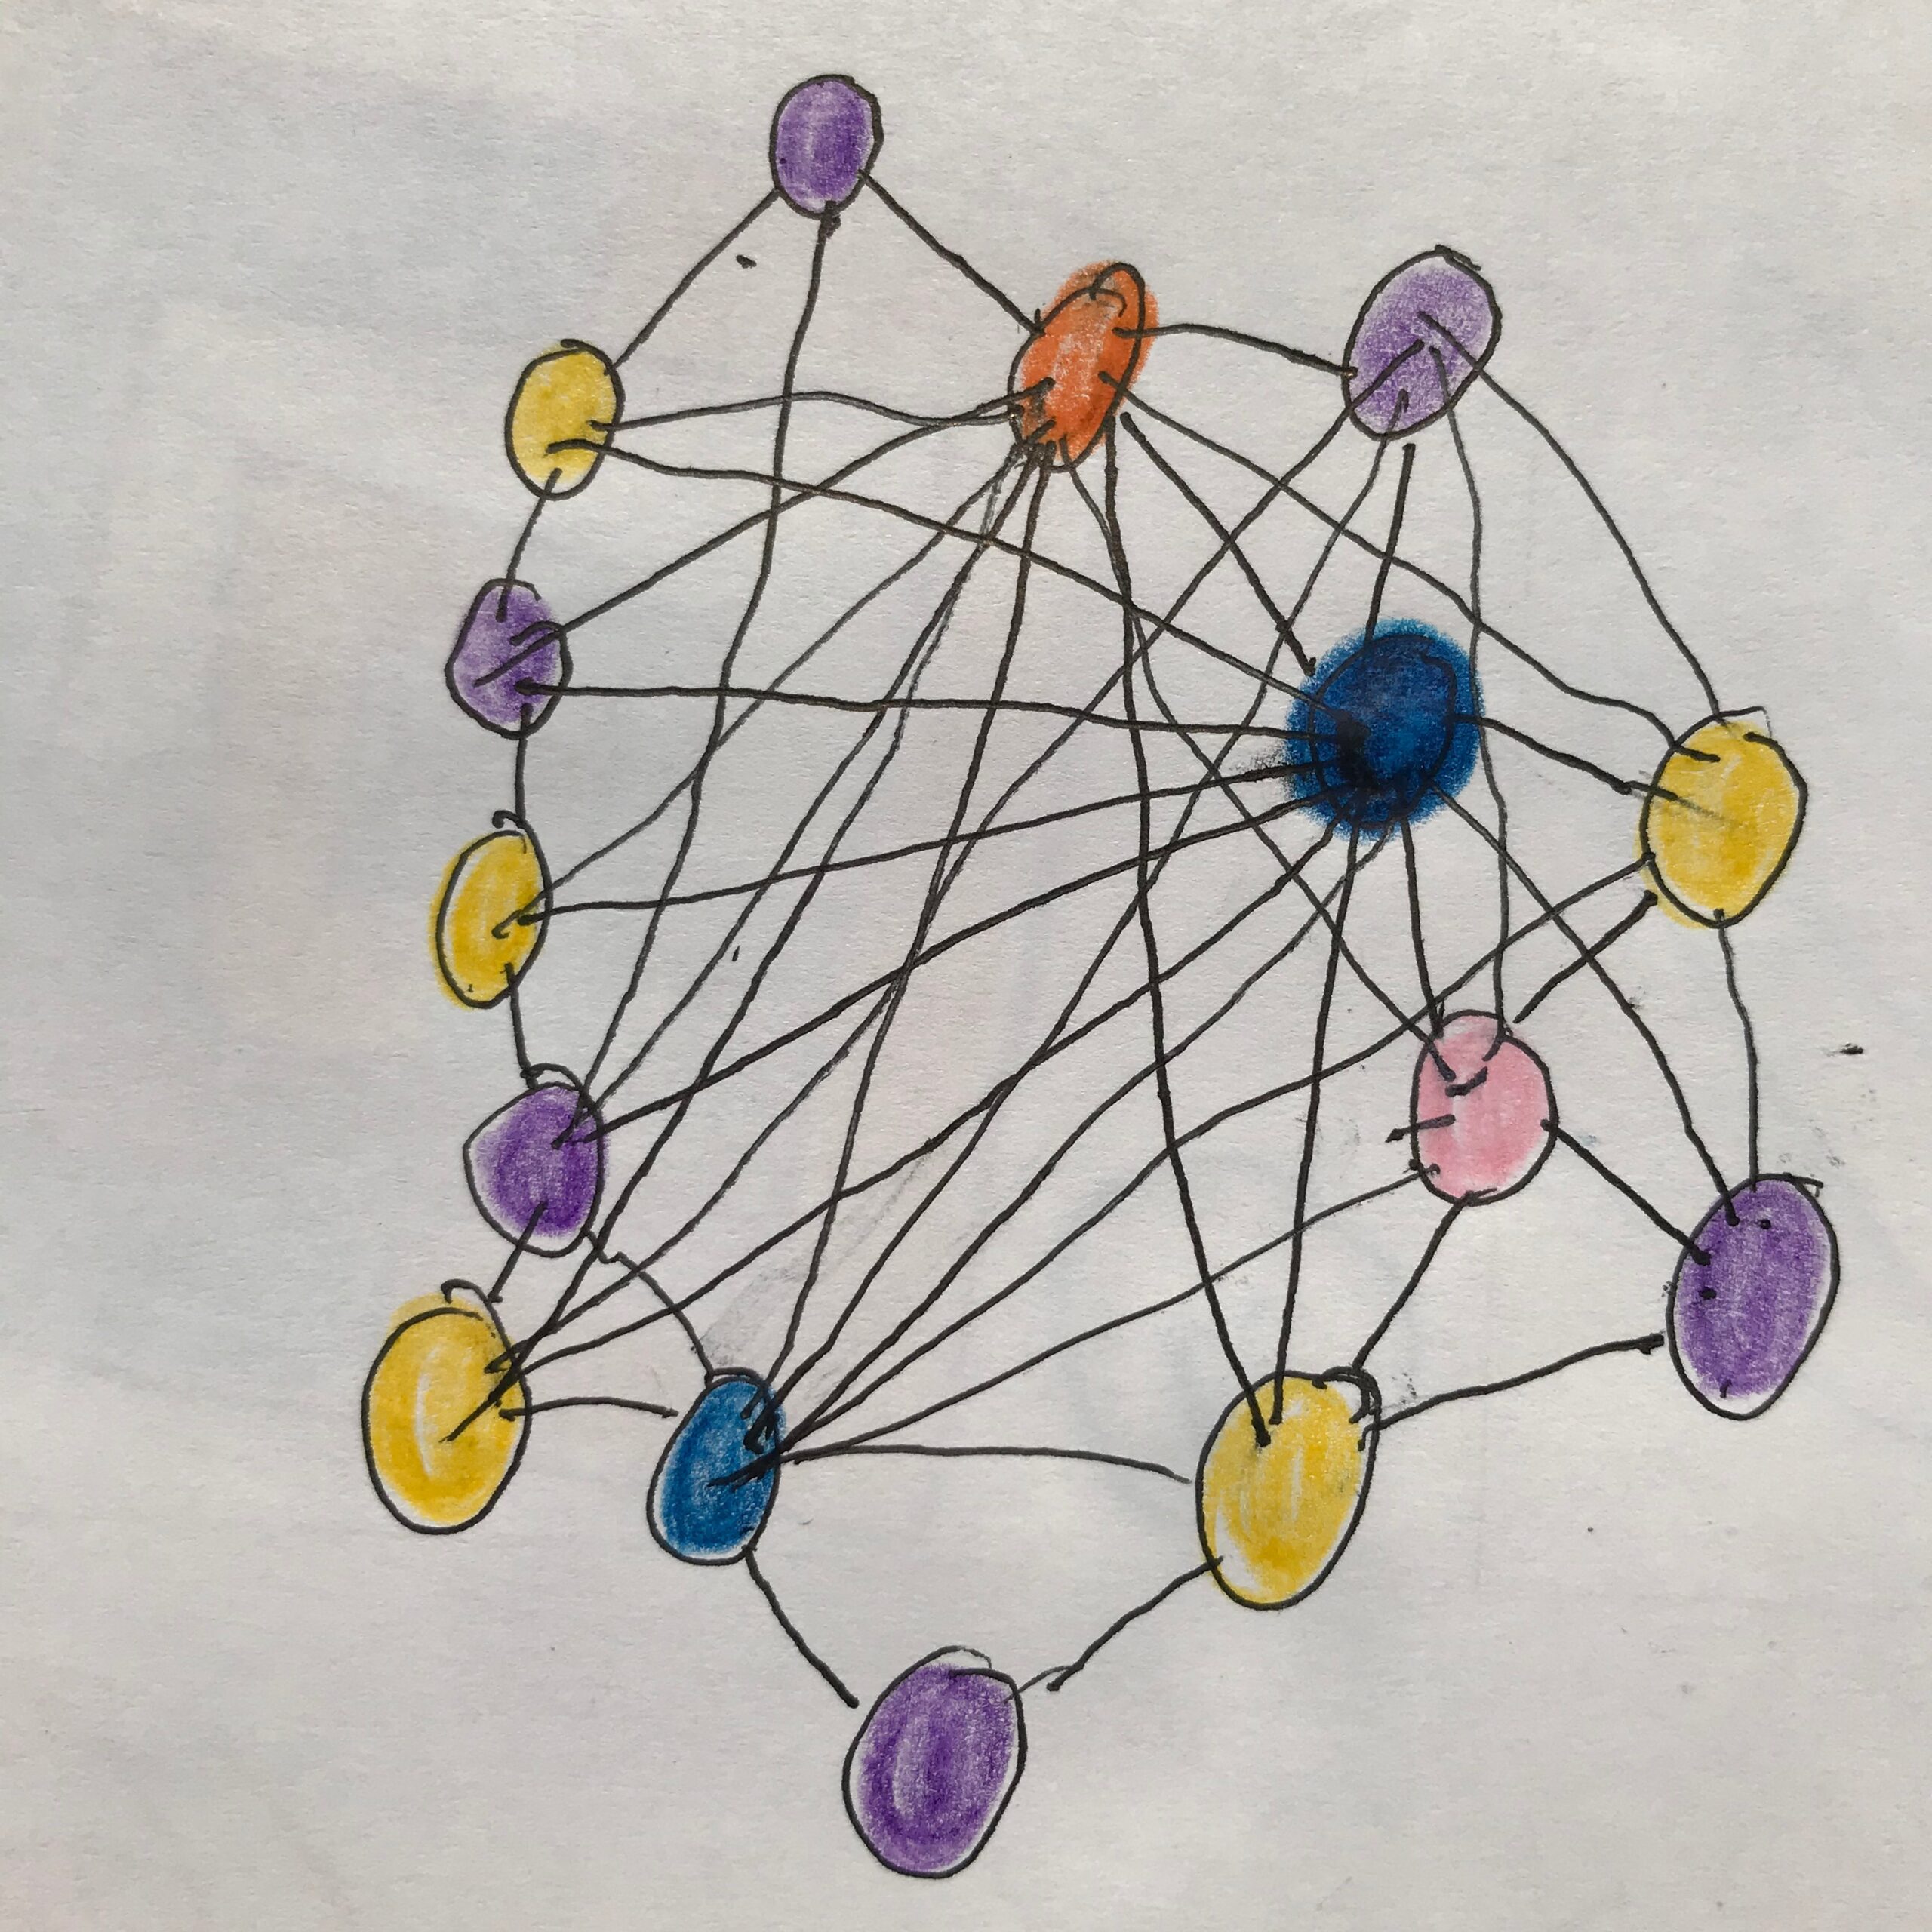
And then came the concept of Impossible Graphs (ones without a path or a circuit). My son loved the idea of trying to make a super-tricky impossible graph (so much so that his graphs began to somewhat resemble the drawings of a madman!)
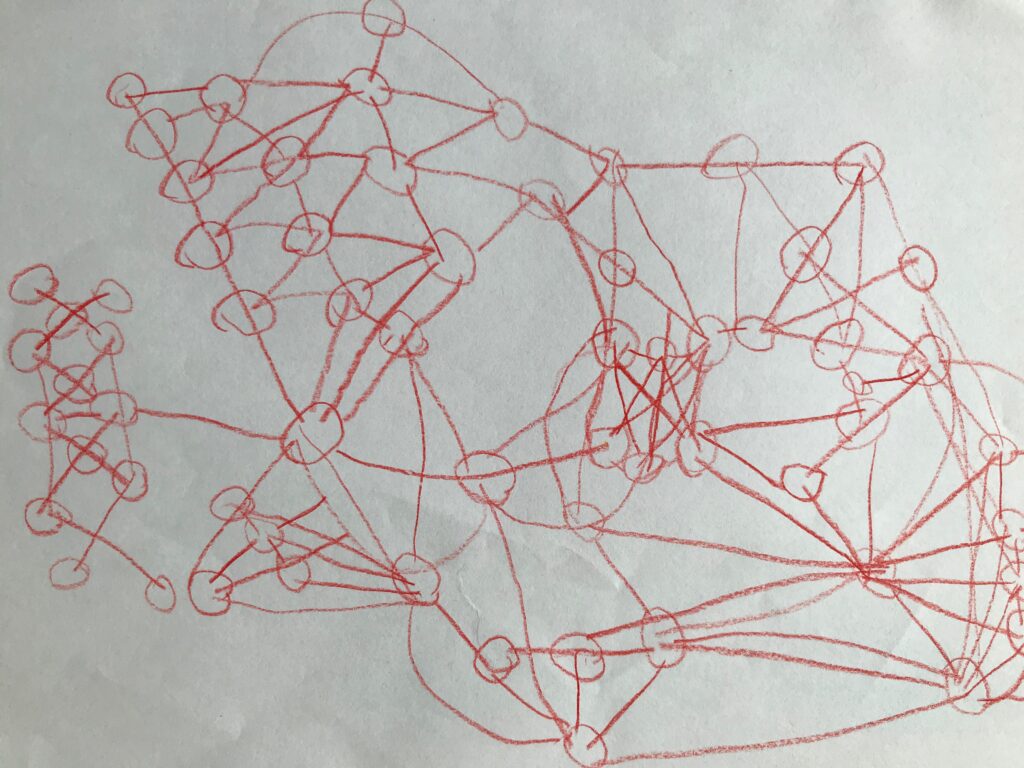
He was so engaged with the idea of impossibility that I decided to have him wrestle with a bigger math question:
What makes a graph impossible?
In the booklet, Dr. Hamkins explains the answer. But I wanted to see what my son would come up with on his own, so I cut these lines from the booklet.
My son stuck with this question for a couple of weeks, working on the concept on and off. Over five or so sittings he would bring me big ideas to test, such as :
“If it includes an impossible graph, it is impossible.”
Example and Counter-Example
While working through his ideas, I was able to introduce the concepts of example and counter-example. He would provide a hypothesis about impossibility, and give an example. I would provide a counter-example that disproved his hypothesis. He drew tons of examples trying to find a pattern.
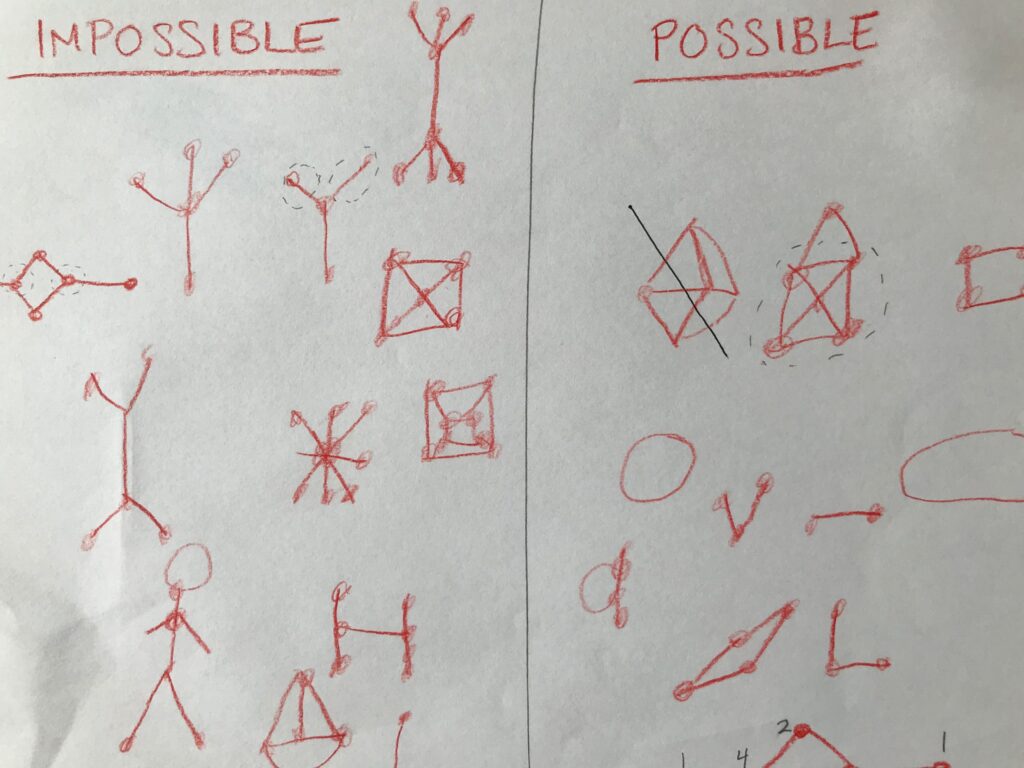
He eventually landed on a feature he dubbed “danglers.” These are nodes that appear to hang off the graph. In his stick figure above, the legs (edges) and feet (vertices) would be “danglers.” We had the following conversation:
Him: For a path, you have to start on one of the danglers and end on one of the danglers. You can only have two danglers. (He draws the below red graph.)
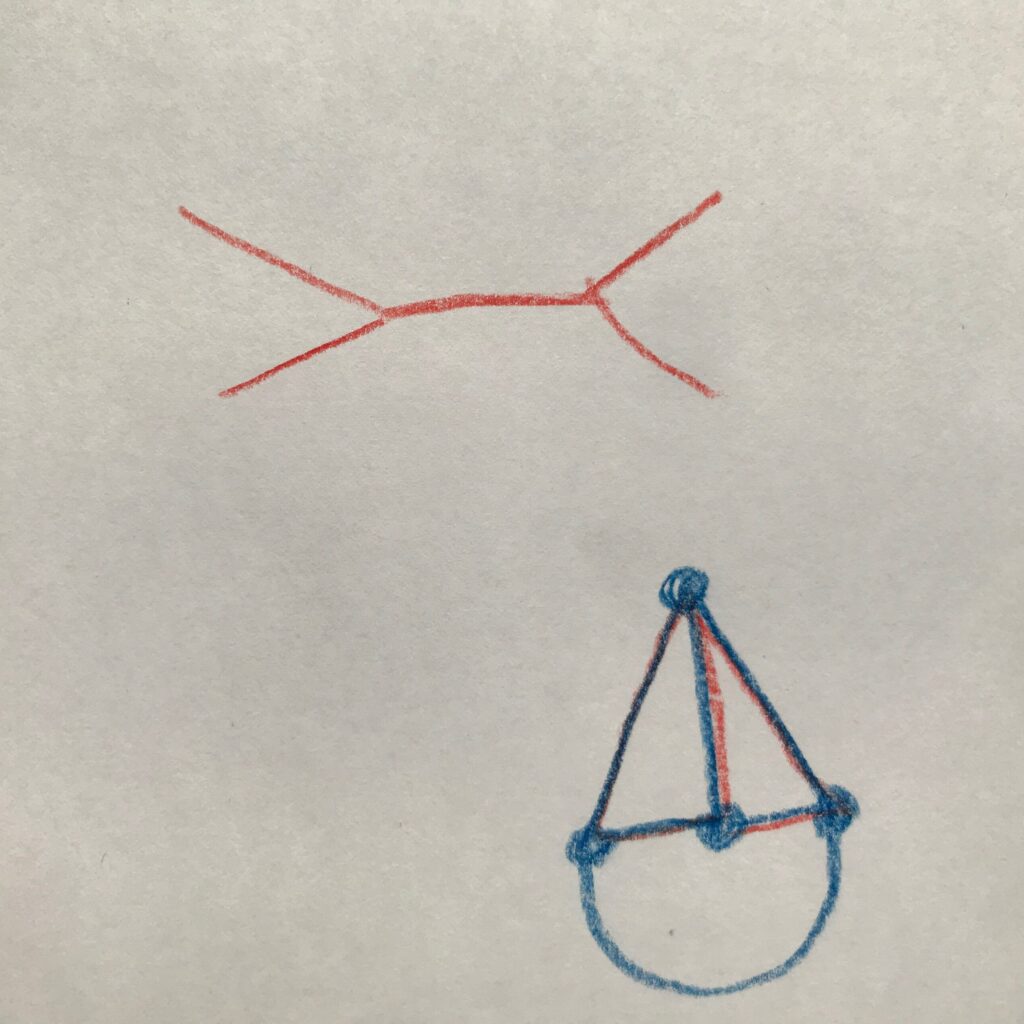
Me: (Drawing the clown face above as a counter-example). This doesn’t seem to have danglers. What makes a dangler? What happens at a dangler?
Him: You can’t go any further.
Me: Why not?
Him: You would fall off the graph.
Me: What would you need to go further?
Him: A bridge to cross.
Me: What’s a bridge in terms of a graph?
Him: The line!
After a long pause — about 5 minutes or so — the “AHA!” moment happened, and he exclaimed: “It has to have an even number of lines or it’s a dangler.” He didn’t need a counter-example. He didn’t need to discuss it any further. He knew.
This was one of the funnest math activity we’ve done to date. Something about the topic, and the way that Dr. Hamkins presented it, kept my son engaged and happily working through “stuck moments” and bigger math ideas over a long period of time. It was so rewarding (for both of us!) to see all of his hard work pay off and come together in that moment of creative realization.
It was well worth sacrificing some skillswork time to dig into the magic of pure math. We can tackle those multiplication tables another day.
If you want to download a copy of the original booklet, click here. His blog is a treasure trove of mathematics! And if you want to make the activity an opportunity for grappling with some big ideas, just cut out the lines on the page before The 7 Bridges.

